

Profit grew twice as fast as ad spend
We switched a footwear store from ROAS-based to margin-based optimization. Ad spend grew 21%, revenue 38% and gross profit 41%. Splitting the catalog by profit also revealed that 9% of products made 91% of the profit while half the budget flowed into products that earned nothing.
of the catalog made 91% of the profit
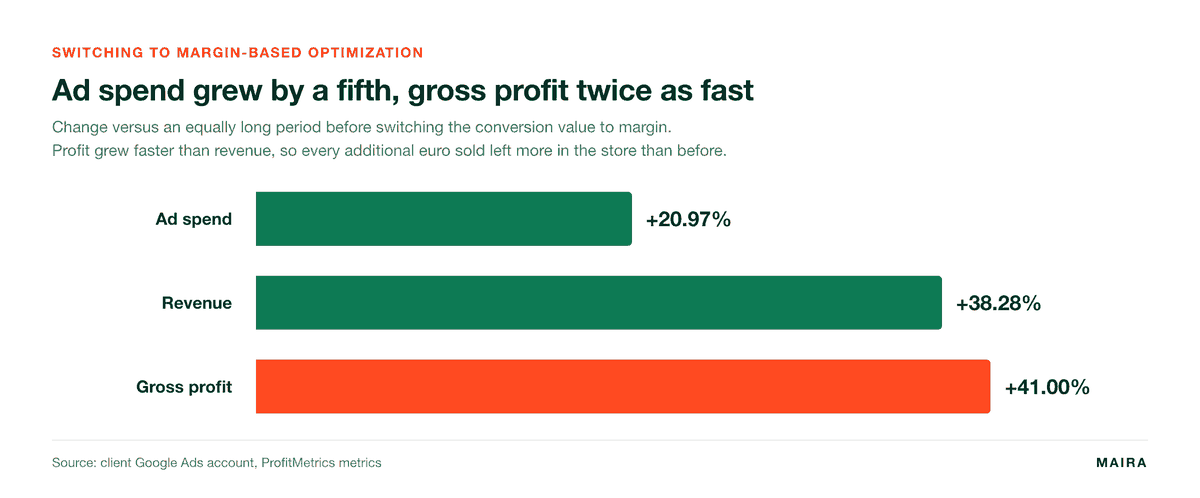
gross profit after switching to margin-based optimization
ad spend over the same period
gross profit in the profitable shopping branch
The store was growing on revenue and not on profit. Campaigns ran on a target ROAS and looked fine in reports. This article is not about POAS being a better metric than ROAS; everyone knows that by now. It is about what we had to fix in the data before the switch was even possible, and what splitting the catalog by profit revealed about where the budget had been flowing.
We are not naming the client. It is a footwear e-commerce store selling internationally, with a catalog of several thousand products and a wide margin spread across the assortment. All numbers in this article come from its account.
What did splitting the catalog by profit reveal?
That 268 products out of 2,879, or 9.3% of the catalog, made 91.1% of the profit. The remaining 2,611 products consumed 51.3% of the budget and delivered 8.9% of the profit. Before switching anything, we had the catalog split by actual contribution to profit, not by revenue.
| Group | Share of catalog | Share of budget | Share of profit | POAS |
|---|---|---|---|---|
| Highly profitable | 5.7% (165 products) | 19.8% | 58.6% | 5.99 |
| Profitable | 3.6% (103 products) | 28.9% | 32.5% | 2.28 |
| Unprofitable | 4.2% (121 products) | 27.5% | 8.2% | 0.60 |
| Low traffic | 86.5% (2,490 products) | 23.8% | 0.7% | 0.06 |
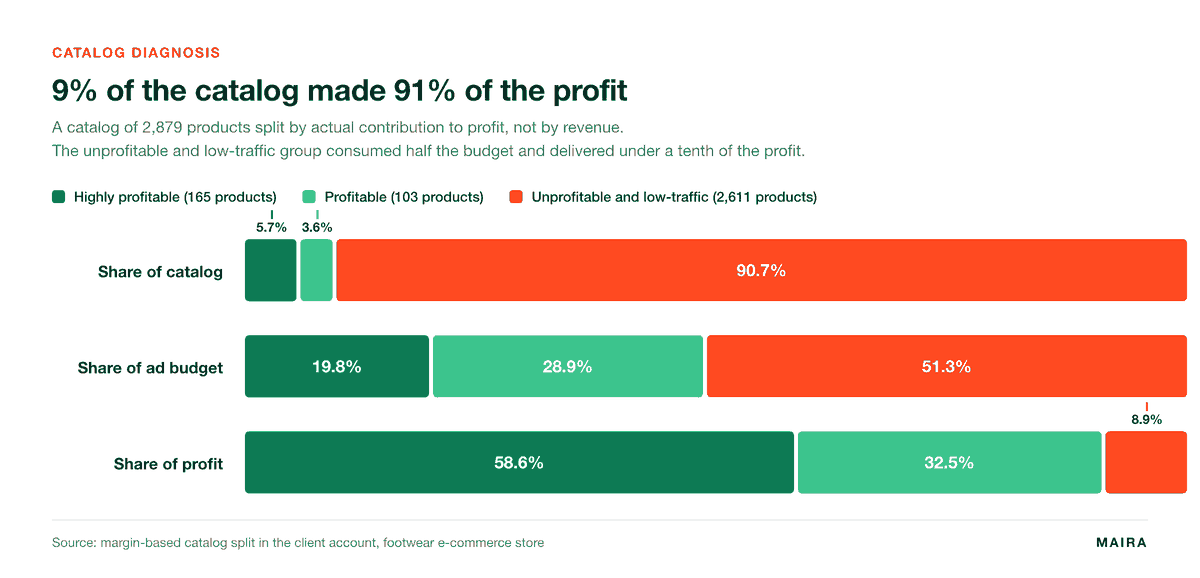
The worst part is the last row. The low-traffic group made up 86.5% of the catalog, consumed almost a quarter of the budget, and its POAS was 0.06. That is six cents of gross profit for every euro sent to advertising.
Why was ROAS misleading for this store?
Because ROAS works with revenue, not margin. The unprofitable products had a ROAS of 1.69 and the low-traffic products 0.42. In a report that looks like weak but existing performance. In profit terms it was a straight loss.
Two campaigns with the same ROAS have a very different impact on profit when one sells goods at a 40% margin and the other at 15%. An algorithm that only sees revenue picks the one that sells more, not the one that earns more. The formulas, a worked example and the difference versus ROI are covered in our glossary entries on POAS and contribution margin. The zero point, break-even ROAS, is the inverse of the margin: at a 40% margin it is 2.5.
What had to be fixed in the data before the switch?
Purchase prices at item level in the feed, ID matching between orders and the feed, variable order costs, returns handling, fallback values, and one consistent margin definition. Switching the bidding strategy itself is twenty minutes of work. The data preparation is what decides the outcome, and it is exactly where most migrations to margin fail.
- Purchase prices in the product feed. Margin is calculated per item, so the feed has to carry the purchase price of every product, not a category average. The average looks like a reasonable compromise and is the fastest way to break the model: margins vary most within a category.
- ID matching between orders and the feed. The order sends an item ID, the feed carries a product ID, and with size variants those are rarely the same. When IDs fail to match, the margin cannot be calculated for part of the orders and the system falls back to a default value. The account then optimizes toward a number it partly made up.
- Variable order costs. Shipping, payment method, packaging. For this store those three items together amounted to roughly 7% of revenue. They must be configured separately by shipping and payment type, not as one flat number: on low-value orders, the difference between cash on delivery and card payment can equal the entire margin.
- Returns. In fashion and footwear this is a critical item, and on the day of the order you know nothing about it. If returns never make it into the margin model, POAS is systematically overstated, most of all on the products with the highest return rates, exactly where it should warn the loudest.
- Fallback values. For every case where the margin cannot be calculated there has to be a defined fallback number. Without it the system sends zero or the full price, and both are worse than a conservative estimate.
- A consistent margin definition. Gross margin or contribution margin. Both are legitimate, but the account has to use one and the same definition across all campaigns and over time. Otherwise POAS cannot be compared between campaigns and target values lose their meaning.
This is agency work done together with the store's developer. No tool will decide for you whether returns belong in the margin, and no tool will tell you that your variants do not match. You only see it in the data, if you know where to look.
How did the switch to margin-based optimization turn out?
Ad spend grew 21%, revenue 38% and gross profit 41%. Profit grew twice as fast as the advertising investment and faster than revenue, which means every additional euro sold left more in the store than before.
| Metric | Change vs. an equally long period before the switch |
|---|---|
| Ad spend | +20.97% |
| Revenue | +38.28% |
| Gross profit | +41.00% |
| ROAS | +14.31% |
| POAS | +16.56% |
For the first two weeks we watched the account daily, not weekly from a report, and four things at once: POAS, ROAS, CPC and conversion volume. CPC to make sure the algorithm did not start overpaying for a narrow group of profitable products, volume to make sure the account did not choke on an overly aggressive target.
Worth noting: ROAS did not drop after the switch, as is often claimed. It grew 14%. So it is not true that profit always has to be paid for with revenue. What is true is that under margin-based optimization, ROAS becomes a control number, not a goal.
What did restructuring shopping by margin deliver?
Gross profit in the profitable branch more than doubled. Once margin measurement was running stably, we split the products by profitability directly in the feed and restructured the campaigns so that each group got its own budget and its own target.
| Campaign | Gross profit | Revenue | POAS | ROAS |
|---|---|---|---|---|
| PMAX, profitable branch | +108.77% | +170.17% | +32.92% | +72.00% |
| PMAX, unprofitable branch | -2.83% | -14.60% | +10.37% | -3.00% |
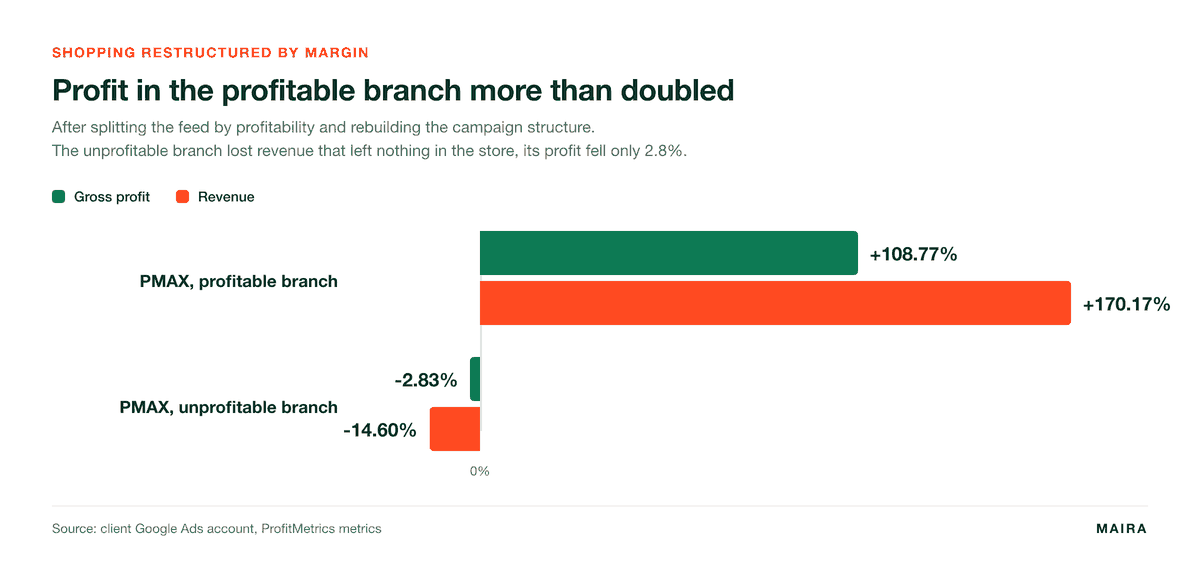
Read the second row carefully. The unprofitable branch lost 14.6% of revenue, but its profit fell only 2.8% and its POAS actually rose 10.4%. What got cut was precisely the revenue that left nothing in the store. The principle is familiar to anyone who has segmented products by ROAS, only here the labeling is done by profit instead of revenue. With a varied-margin assortment, those are two completely different groups of products.
When does margin-based optimization not make sense?
We do not want to turn POAS into a universal answer. There are accounts where it is wasted work, and it is better to know that upfront than after three months.
- A uniform margin across the assortment. When margins do not vary, POAS is just ROAS multiplied by a constant and adds no new information.
- Missing purchase prices. If the store does not have item-level purchase prices in its system and cannot get them into the feed, there is nothing to calculate the margin from. That gets solved before advertising does.
- Low conversion volume. The bidding algorithm needs data. On an account with dozens of conversions per month, a new conversion value only prolongs the learning phase.
- Services and lead gen without a clear order value. There the question is lead quality, not margin, and that is a different project.
If you are in one of these situations, save yourself the effort and put the energy into measurement, MER and clean attribution instead.
Where does ProfitMetrics fit in?
We calculated the margin and sent it to the ad platforms through ProfitMetrics. We are its partner, which we are stating openly so there is no doubt.
It calculates profit per individual order in real time and sends it to the ad platforms as the conversion value, which removes the need to match margins in reporting afterwards. The feed with purchase prices, fallback values for shipping and payment types, and the connection to the measurement layer are all configured in one place. The profitability-based catalog split behind the table at the top of this article is one of its add-ons.
What the tool will not do: it will not decide your margin definition, match broken IDs, tell you when to loosen the target so the account does not choke, or rebuild your campaign structure. That is work on the account and it stays with the team running it. How we approach it is described on our Google Ads agency and e-commerce marketing pages.
Frequently asked questions
What is the difference between ROAS and POAS?
ROAS is the ratio of revenue to ad spend, POAS is the ratio of profit to ad spend. ROAS does not see margin, POAS is built on it. Two campaigns with the same ROAS can have a completely different impact on profit. Formulas and a worked example are in our POAS glossary entry.
Will my ROAS drop after switching to POAS?
Not necessarily. In this account, ROAS grew 14% after the switch while gross profit grew 41%. It can drop, and that is not a problem as long as profit grows. Under margin-based optimization, ROAS is a control number, not a goal.
How long does the transition to margin-based optimization take?
Switching the bidding strategy itself takes minutes. What decides the timeline is the data preparation on the store's side: purchase prices in the feed, ID matching and variable cost setup. In this account we saw the first results after two weeks.
Does the store need purchase prices in the product feed?
Yes, at the level of the individual item. A category average breaks the margin model, because margins vary most within a category. Without item-level purchase prices in the store's system, there is no point starting a POAS migration at all.
Do shipping costs and returns count toward the margin?
It depends on the definition. Gross margin is revenue excluding VAT minus the purchase price of goods; contribution margin also subtracts variable order costs including shipping, payments and returns. For the store in this article, shipping, payments and packaging amounted to roughly 7% of revenue, so the difference between the two definitions is not negligible. The account has to stick to one definition across all campaigns.
For which stores does margin-based optimization not make sense?
For accounts with a uniform margin across the assortment, without purchase prices in the system, with low conversion volume, or for lead gen without a clear order value. In all four cases the energy is better spent on measurement and attribution.
Conclusion
POAS as a metric is well known by now. The difference lies in how margin-based optimization gets set up, and that stands or falls on the store's data, not on the choice of tool. When the margin is calculated correctly, the algorithm starts investing where the store actually keeps money, and that shows up in the account within two weeks.
Growing on revenue but not on profit? Get in touch. We will walk through what your store needs for the switch to margin, where the gaps in the data are, and build the setup together. We run profit-based optimization on accounts across European markets and work with ProfitMetrics directly. Margin data pipelines and reporting are part of our AI marketing automation service.

Vojtěch Vacek
PPC Team Leader
In the MAIRA team, I lead the PPC team and focus primarily on performance advertising for e‑commerce projects. I enjoy connecting performance campaigns with the client’s real business and turning that connection into tangible results.